One of the most common analysis is called a 'green field' analysis and consists in redesigning the supply chain network from scratch. The aim is to understand what an ideal network would look like, irrespective of the current investments. The network is designed for future growth, often projecting at least 10 years ahead. Once a new network is obtained, we can compare it to the current network and decide what changes need to be made, if any.
While the green field analysis ignores the locations of the current warehouses, it requires the locations of potential warehouses. It is important to give enough choices for the program to choose from so that it can select the most optimal ones to operate. Too few choices would lead to a sub-optimal network. It is also important to not overwhelm the software with spurious choices that we know won't be operated. Too many choices would lead to long solve times and long analysis turn around times that could reduce the impact of the analysis. Similarly, it can be helpful to aggregate the customer demand into a smaller set of locations if there are many customers. Doing so helps make the analysis faster.
Tip: while giving options to the algorithm to find the best locations is important when searching for the optimal network, it can be useful to restrict the choices in some cases. We recommend running several scenarios when selecting a network. Scenarios can help answer questions like: What would happen if demand is 10% higher than expected? What would happen if demand shifts to the West Coast? When running scenarios, you do not want the software to relocate the warehouses to better location but instead to use the selected locations and provide information such as the cost of running the network. One way to force the software to use only the selected locations is to restrict the available location to that set.
Tip: start with the locations you are operating currently only and your current demand. The optimal network will be identical or very similar to your current network. Check that the costs are also similar to your current costs. If they are not, there may be a mistake in your data.
One other common analysis is called a 'brown field' analysis and consists in redesigning the supply chain network but keeping some of the current warehouses opened. When a company is growing, the question to answer may be: where to open a new warehouse while keeping the current ones opened? If a company is shrinking, the question to answer may be: which warehouse to close? In both cases we want to take the current network into account and only make some changes. These questions can also be answered with the facility location template.
You can follow up the facility location analysis with a more in-depth modeling of the supply chain network using the Network Design Template or with a step-by-step transformation plan from your current network to the ideal network using the Network Design Transformation Plan Template.
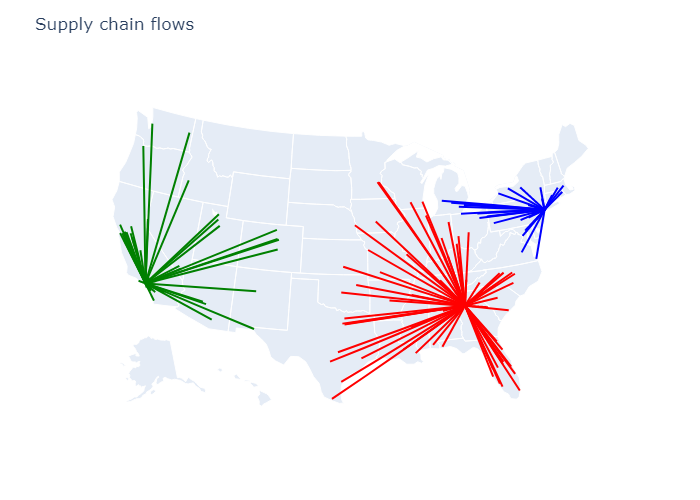
Do you need help with a worked example? You can download a sample spreadsheet. In the sample we want to find the best way to serve our US customers. The customers are represented by 150 demand points, each located in one of the 150 biggest cities in the US and each with a demand proportional to the population of the city. We can serve the customers by choosing amongst 20 warehouse locations, each located in one of the 20th biggest cities in the US. The potential warehouses have the same fixed costs and the same maximum throughput. The transportation costs are proportional to the distance to travel. The problem file is available here: sample problem spreadsheet.
The results sent in e-mail after the problem is solved contains the facilities to open and the shipments to send. For our sample data the optimal solution is to open three warehouses: one in Los Angeles, one in Atlanta and one in New York. The solution file for the sample problem is available here: sample solution spreadsheet.
(The city data is gratiously provided by simplemaps.)